The Only Way to Analyze Data in Excel
Excel is a powerful tool for data analysis, but only indirectly so. The real power comes from a feature-turned-component of Excel called Power Power Query.

If you're using any other method in Excel to analyze data or set up a repetitive workflow- STOP. If you've never heard of Power Query before I implore you to read on and follow along- this skill is worth picking up.
What is Power Query?
Power Query is a tool in Excel that allows you to connect to data sources, transform data, and load it into Excel. It's a powerful tool for data analysis and can be used to create easy workflows or complex data pipelines in a more visual way than other methods.
Power Query wasn't always a part of Excel. It was first introduced in Excel 2010 as an add-in (Get and Transform Data) and was later integrated into the main application in Excel 2013.
How to use Power Query
Let's begin with location- inside your excel workbook, Power Query is located in the Data tab. This whole section is about obtaining data from sources such as databases, APIs, csv files and more.
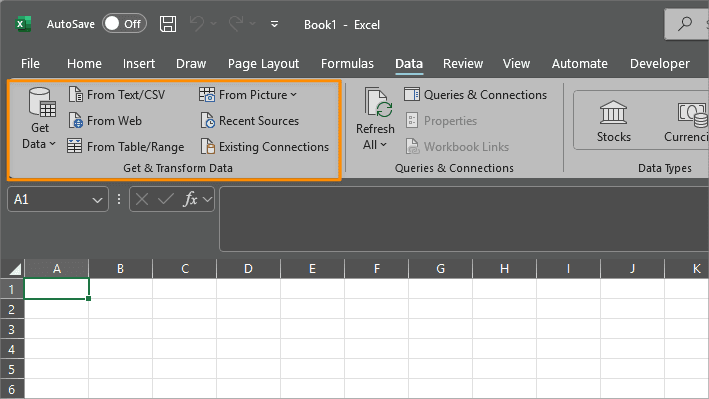

The "Get Data" dropdown used to offer a larger option of sources, but Microsoft has since deprecated or repurposed most of them to be used in PowerBI Desktop- for more heavy duty data analysis and visualizations.
Analyzing Data
Now that we know where to find Power Query, let's start analyzing data.
Step 1: Get Data
Let's click on the "From Web" option above. We're choosing this option because anyone can pull data from these web sources. In the From Web Dialog, we'll be able to paste in a URL and then click "OK" to begin getting our data.
https://data.cityofnewyork.us/resource/erm2-nwe9.json
You may see a dialog asking about Access Web Content you can leave this on annonymous and click Connect to continue. After a few seconds- the power query window will open with the data from the web source.
Step 2: Data Preparation
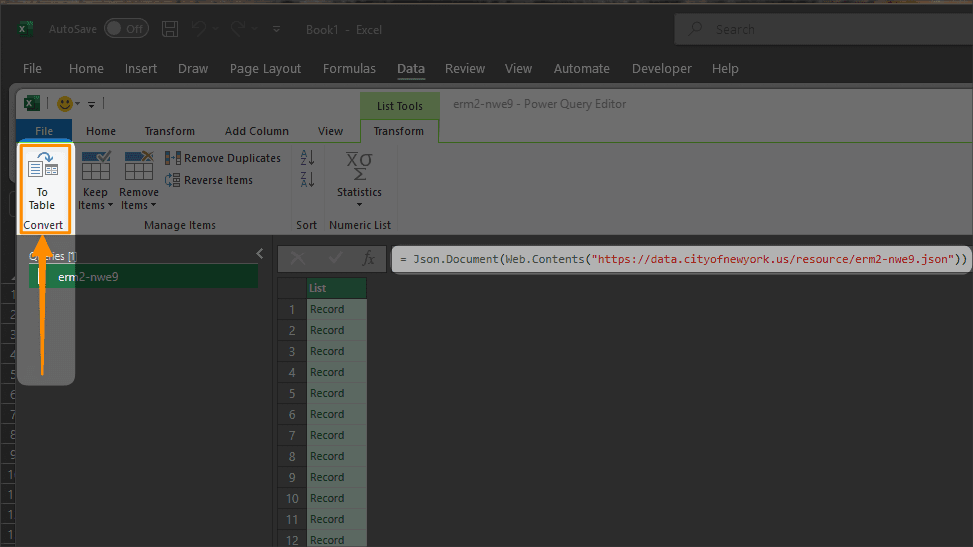
Our data right now is just a list of records from the web. This is typical and expected- with most web sources we get data in this way- sometimes refered to as jsonl (json lines).
Power Query provides a convenient way to handle this type of data and has a To Table function that will convert the data into a table- exactly what we want.
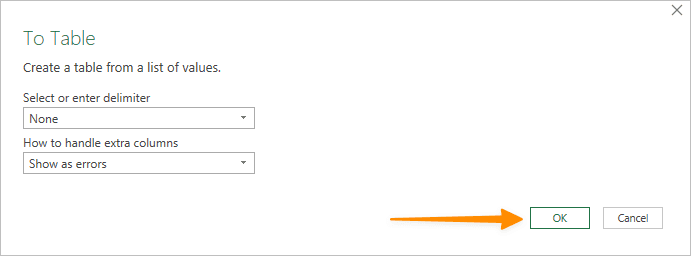
We may see a dialog asking specifically how we want to convert the list of
values into a table. We don't need to change anything here- so we can just
click OK to continue.
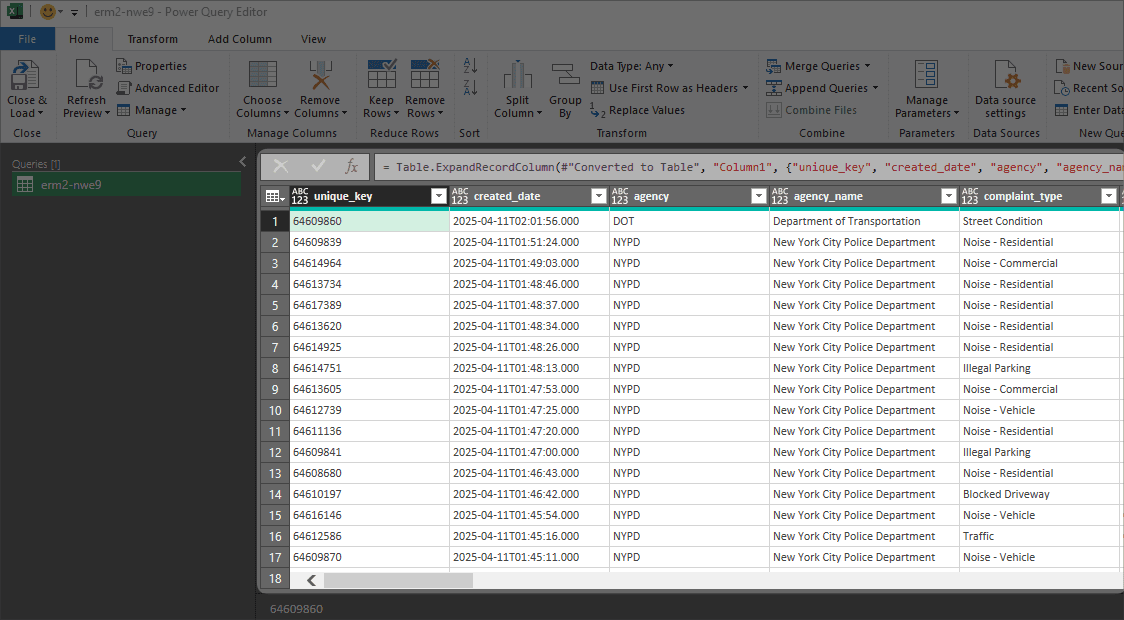
Now we get... another list of records? Not quite. Power Query has converted the list of records into a table of records. We can now expand each record to create our table columns.
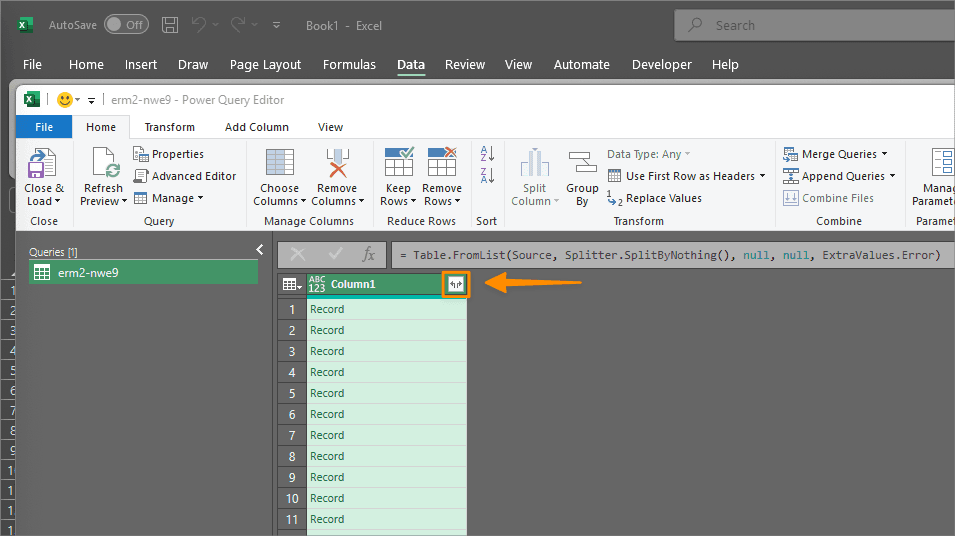
make sure that the Select All Columns checkbox is checked and the Use original column name as prefix option is NOT checked.
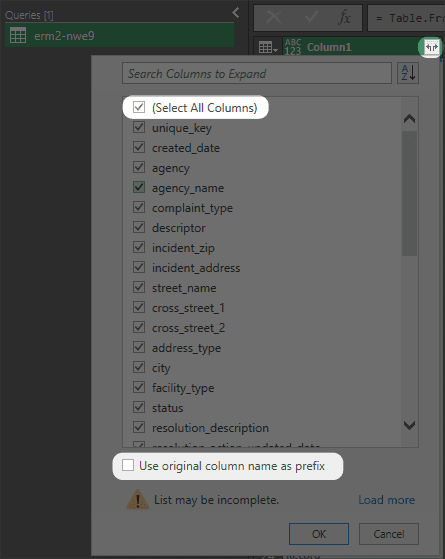
Now we have some data! As of the time of this writing, there should be around 38 columns in our table once fully expanded.
Step 3: Data Transformation
Power Query provides a number of tools to transform our data and get it ready for analysis. We'll do a few things here:
- Remove unused columns.
- Change the column types to the correct type.
- Manipulate dates.
- Summarize and aggregate the data.
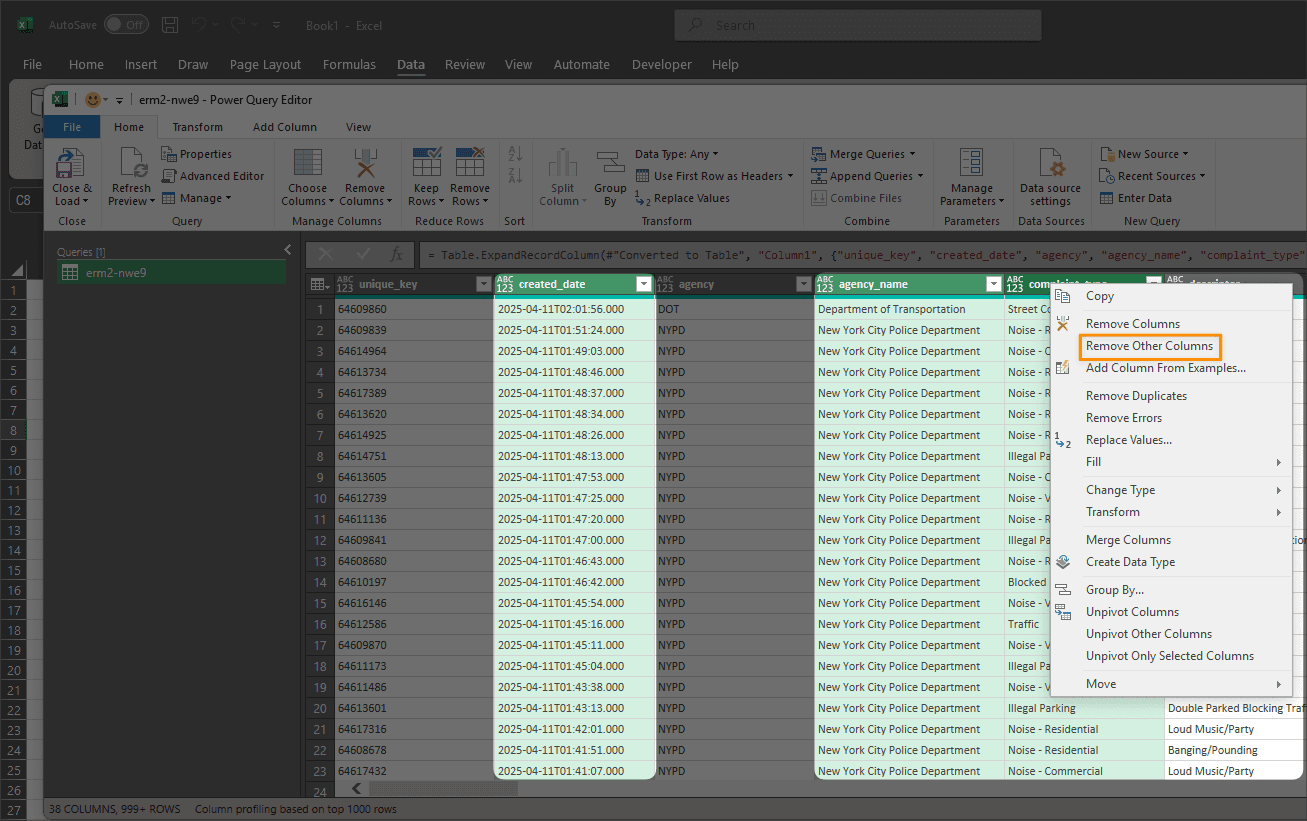
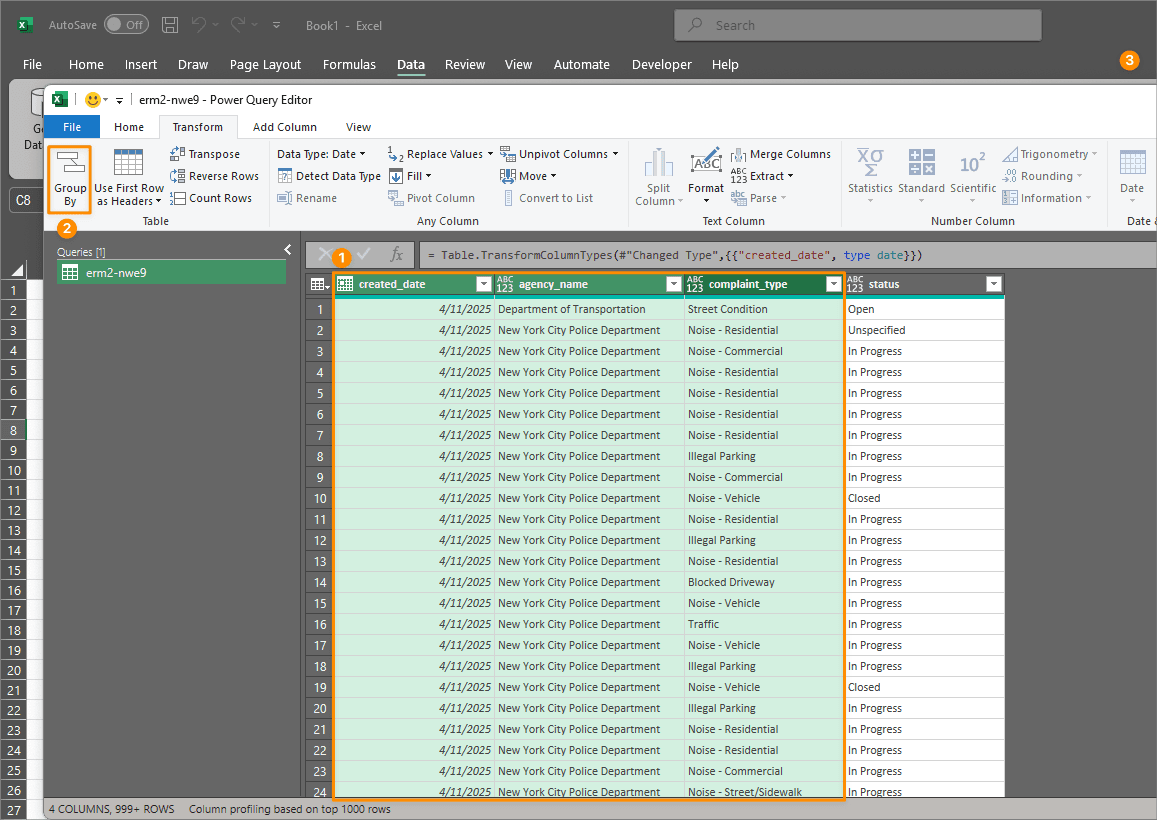
First, let's remove the unused columns. For our illustration we want to keep the created_date, agency_name, complaint_type and status columns. We can do this by selecting these columns one by one while holding down the Ctrl key to multi-select. Once we have selected the columns we want to keep, we can right-click any column already selected and click Remove Other Columns.
Once we've removed all the other columns, let's change the column types to the correct type.
The main one we want to change is the created_date column. We can do this by right-clicking the column and then clicking the Change Type > Date/Time option first. Next to get just the date we right-click again and click the Change Type > Date option.
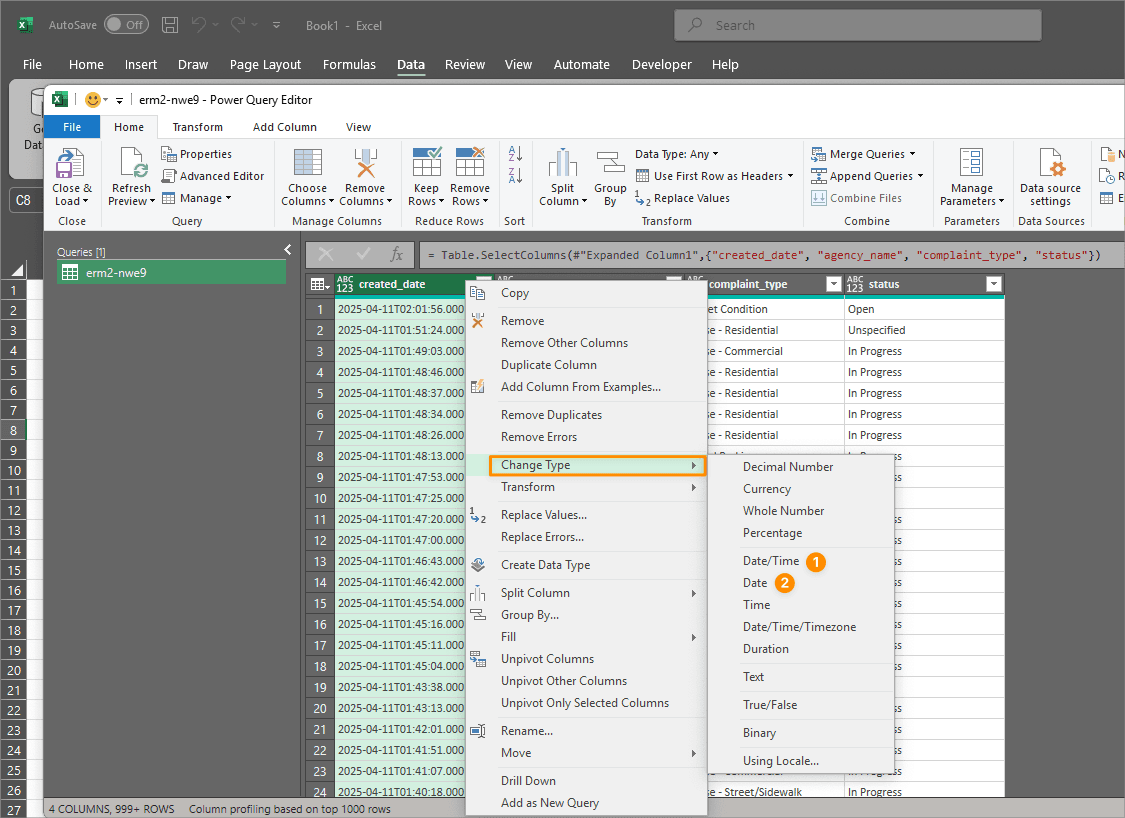
We first change the type to date/time because Power Query has an easier time detecting this column as a date/time column because of the format (seconds and timezone info). Once we've chnaged it to a valid date/time column, power query internally knows how to convert it to a date.
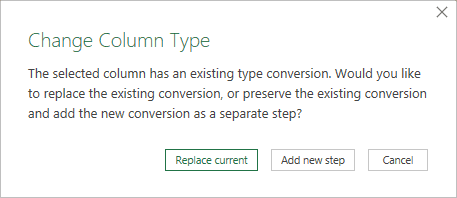
You'll get a dialog asking if you want to replace the existing change you made with this new change.
We want to Add new step because we dileberately changed the type to date/time first then changed it to date afterwards.
Now we're ready for some aggregations. We'll multi-select our created_date, agency_name and complaint_type columns and then click the Group By button.
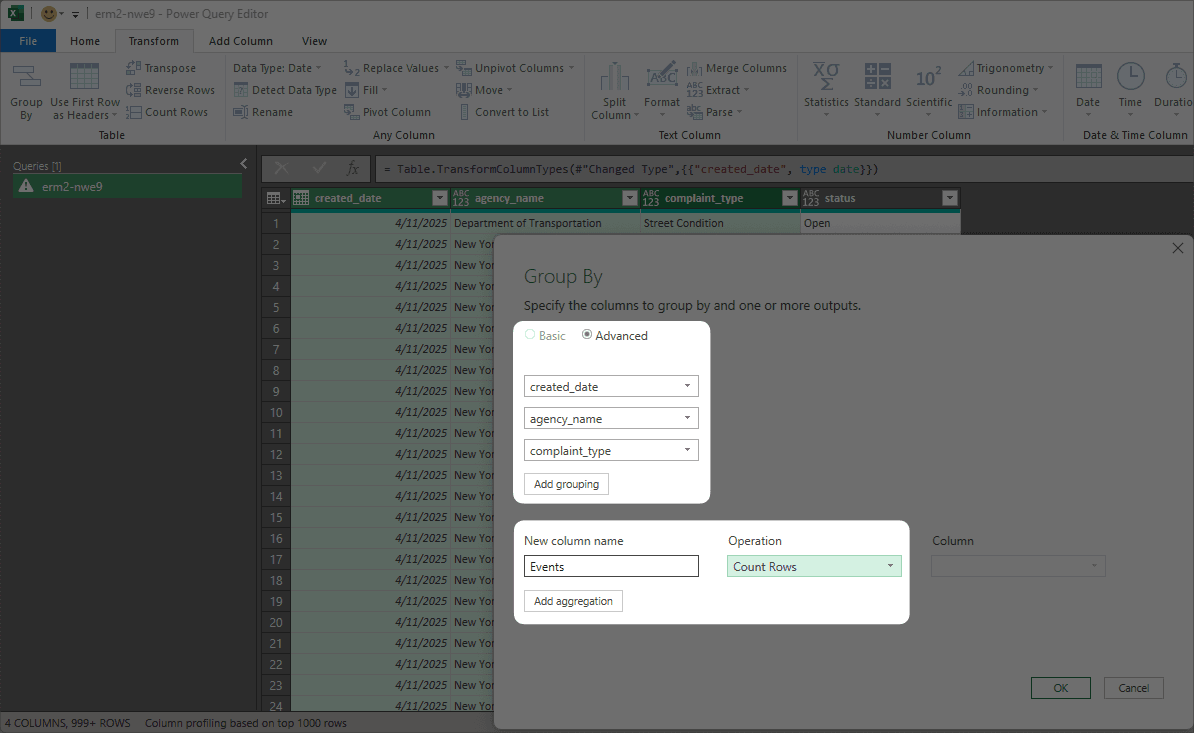
Once we get to the Group By dialog, we note that the columns we selected appear in the grouping section. For the aggregation section we can create a new column name of Events and choose an operation of Count Rows. For the count rows operation we don't need to specify a column to aggregate- as it works on the entire dataset.
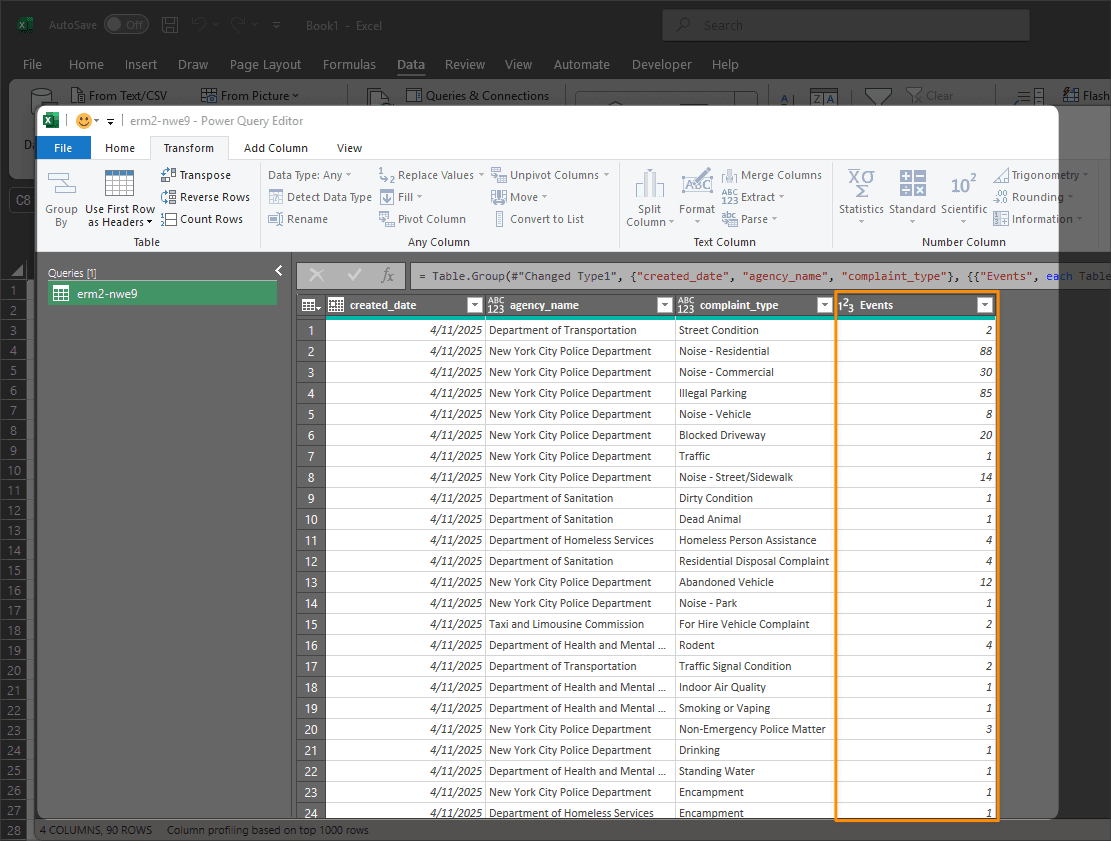
Once we click OK we get a new column called Events that contains the count of rows for each grouping of columns we selected. Now we have a summarized list of complaints by agency by day that can be used for further analysis. Perfect!
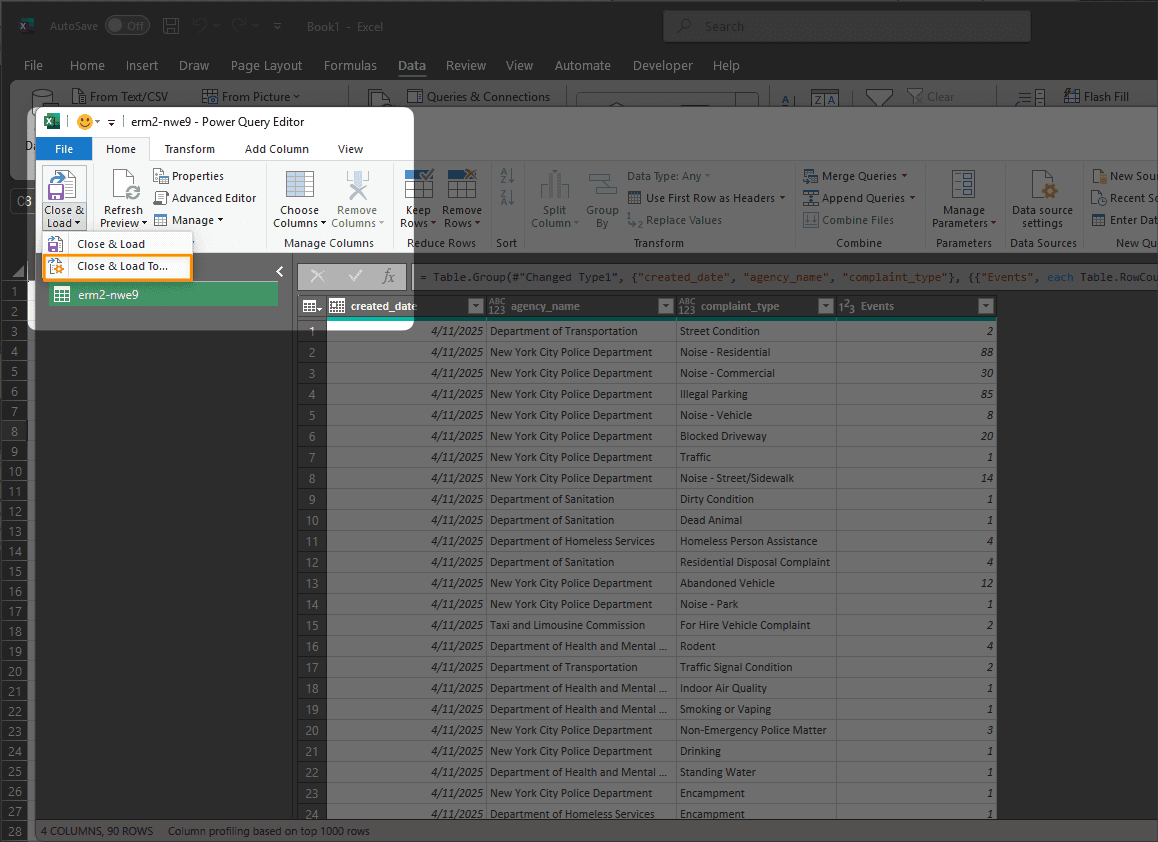
Step 4: Locked and Loaded...
We can load this data into excel by clicking the Close & Load To... button.
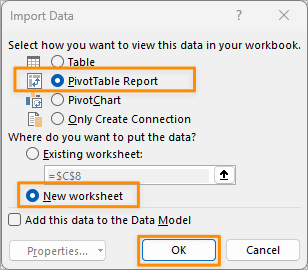
Choose a Pivot Table or Pivot Chart to load the data.
All done! We've loaded our data (sample) into excel and can now simply click the Refresh button to update the data and draw updated data from our data source (in this case, the NYC 311 Complaints API).
If you noticed that the events always seem to total 1000, that's because the data source might apply rate limits to provide only 1000 rows when it's queried from an anonymous user (us). This important framework is a common practice for most APIs. They do this to prevent abuse of the service by bad actors- particularly to prevent overloading and potentially crashing the server.